9 stages of effective performance testing process | Software Testing Company a1qa

System performance testing is carried out to check the compliance with the specified requirements, ensure that software applications function smoothly under the expected and substantial workload and are ready for real-life operation.
In today’s article, we will talk about the sequence of checks conducted and the features of all 9 main stages:
- Software analysis and requirements preparation
- Strategy design
- Load generator configuration
- Server and load generator monitoring
- Test data generation
- Load scripts development
- Preliminary tests launch
- Tests execution
- Results analysis and reporting.
Stage 1 — Software analysis and requirements preparation
The development of the system under test must be completed. Otherwise, the results received will be invalid.
Before conducting performance testing, it is important to make sure that the software configuration has been adjusted appropriately. When the system is deployed, functional testing should be carried out to ensure that the major functionality used for performance checks operates correctly.
System analysis includes the examination of its features, operation mode, and peculiarities. Detailed analysis is required to achieve the following purposes:
- simulate the most adequate user behavior patterns and load profile
- determine the necessary amount of test data
- find the system bottlenecks
- define the software methods for monitoring.
The criteria that the system technically corresponds to are called the requirements.
The major emphasis should be put on defining the success criteria for the tests conducted which are usually included in the SLA (service-level agreement).
The requirements defined during the first stage will be compared to the received results in order to evaluate the behavior of the product and system units and determine the bottlenecks.

The following metrics are used as success criteria:

Sometimes the system analysis and requirements collection take place throughout the whole project lifecycle. If the software is already in use, the analysis of the target audience and their actions will show, which parts of the application are of critical importance and how the interaction with the system occurs.
Stage 2 — Strategy design
The testing strategy is developed on the basis of detailed system analysis and describes an extended approach to performance testing.
System analysis includes all the information regarding the software, testing goals, application requirements, test stand configuration, testing monitoring, user behavior scenarios, load profile, load model, performance testing tools, planned test runs, and the way of providing the results.
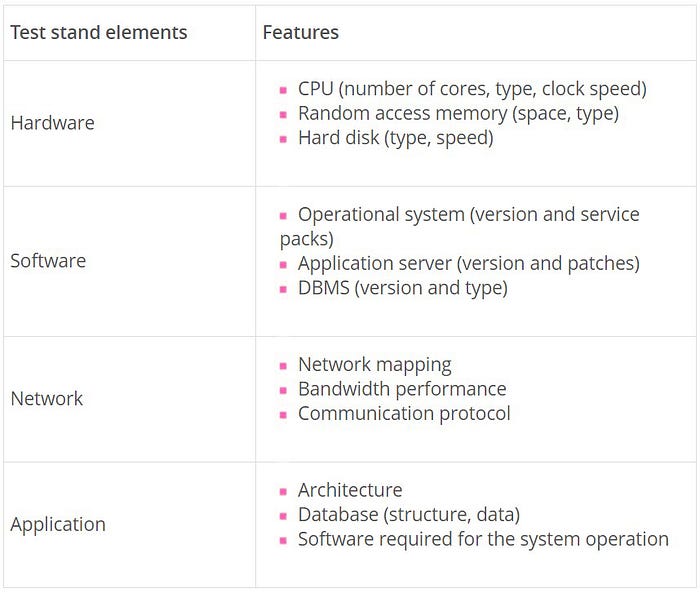
Test stand configuration
The performance testing results may be influenced by various factors such as test stand configuration, network load, database content, and many more.
Therefore, to receive the most reliable results, performance testing should be conducted in a separate environment with features and configuration close to the parameters of the real software.
Load profile and load model design
Statistics on the application usage are collected as a part of the performance testing process. The collected data is necessary for designing the load profile — a user behavior model.
Various load models can be applied to the same test. For example, one new virtual user may be added every five minutes or all users — at once. The key feature of the load model is a query rate, test duration, and the number of users.
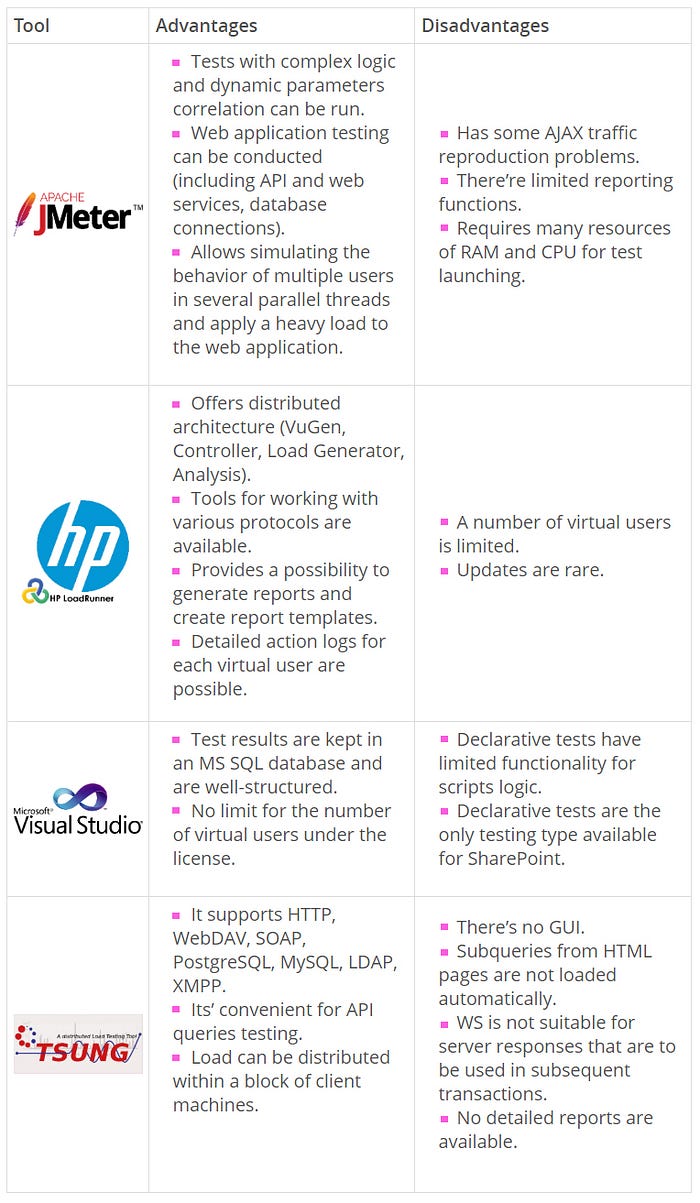
Choosing optimal performance testing tool
The following tools can be used to conduct performance testing:
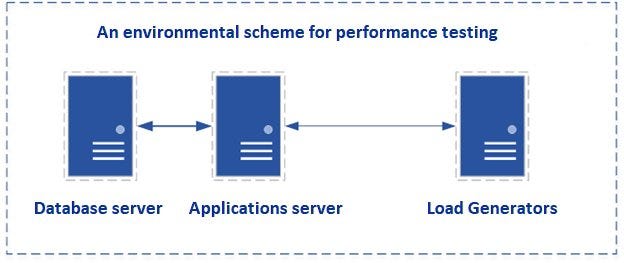
Stage 3 — Load generator configuration
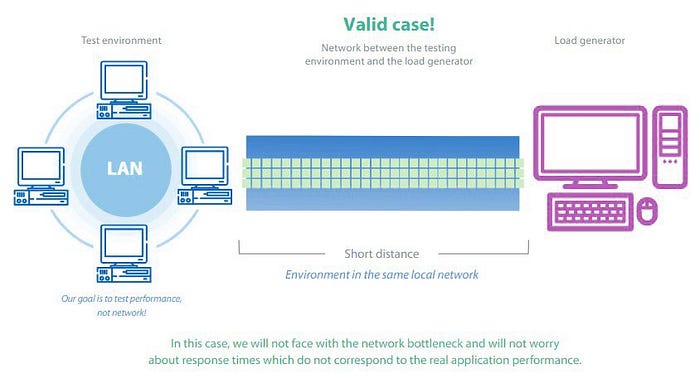
In order to obtain high-quality results, performance testing tools should be installed on a load generator. It is a virtual or physical machine located in proximity to the application server(s).
If a high load is to be generated, the resources of one machine may be insufficient. In this case, distributed performance testing is conducted.
Stage 4 — Server and load generator monitoring
The metrics defined at the first stage are used to evaluate the software performance and define the system bottlenecks.
The information obtained from the monitoring of all application servers and resources is used for performance testing results analysis.
Software monitoring can be conducted with the help of the tools for system hardware resources consumption control.
The most popular tools for hardware monitoring are enlisted below:
- Nmon
The tool saves and displays a brief overview of the following metrics: memory, hard disk, network, file systems. It does not consume much of the CPU resources (usually below 2%).
Nmon is available in two modes.
- Online mode.
When the tool is launched, the command line screen will display the monitoring information.
2. Data record mode
The data collected during the monitoring is saved in a CSV file that can be used as a data set for creating diagrams and manual results analysis.
- Performance Monitor
The data is gathered with the help of a data collector. The results of the monitoring are contained in a BLG file, which is later converted to a CSV file.
PAL (Performance Analysis of Logs) can be used to structure the data and create diagrams.
- Zabbix
The software follows the “server-agent” approach. The server collects all the data and allows viewing the monitoring history and setting up metrics and rules.
- Grafana
This very monitoring data visualization tool is able to analyze data from a time series database for Graphite, InfluxDB, and OpenTSDB.
- New Relic
The performance tracking service provides analytics for each piece of the environment. The tool is an effective way of viewing and analyzing huge amounts of data and getting information about real-time actions.
Database profiling
Database profiling helps reveal, which queries, procedures and triggers decrease the application performance. This quick software diagnostic allows fixing errors instead of searching for them.
- PostgreSQL is a free object-relational database management system. pgBadger profiler can be used for reaching the performance testing goals.
pgBadger is a Postrgre SQL log analyzer that provides general query statistics, information on slow queries, data on connections and servers, and others.
- MS SQL Server Profiler is a tool for tracking, reconstruction, and debugging of the MS SQL Server. It allows creating and processing queries, reproducing and analyzing queries results.
Web servers profiling
All the systems are unique. The use of profiling helps understand how to increase software performance.
JProfiler combines CPU, memory, and thread profiling, so it’s easy to figure out what should be optimized, eliminated, or amended. This tool can be used both for local services and remote sessions.
PHP profiling
Code profiling helps reveal slow code elements and improve them if necessary.
- Xdebug is a powerful tool applied for analyzing PHP code, detecting its bottlenecks and slow elements.
- XHprof decomposes the application into function calls (methods) and creates the statistics on their resources consumption. The results include various metrics: the amount of allocated memory, number of function calls, execution time, and many more.
Stage 5 — Test data generation
Let’s discuss four types of test data generation:
- Code
Scripts developed in various programming languages (Java, Python) allow creating users, passwords, and other values necessary for correct data usage.
- SQL querries
A database can also be filled with the help of SQL queries. This method is available only if there’s access to the database form the server side.
The approach can be implemented as follows: first, one creates a completed DB in MS Access with fields identical to the database on the server side; secondly, a dump file that will contain requests to add information to the DB will be created.
- API calls
API requests can be used to fill the DB with items for sale or user data. One or two calls will be enough to send the data to the server.
- Interface
A script mimicking the steps of the user registration process can be developed for filling the database through the system interface.
New users created by the script are recorded to the database. A snapshot of the file system can be made in order to use the created users for tests execution.
Stage 6 — Load scripts development
At this stage, performance testing scripts are created with the help of the chosen tool.
This stage includes:
- Script analysis
The prepared scripts should be analyzed before the development of load test cases. When each of the steps has been checked manually and no errors have appeared, the load script can be recorded.
2. Test cases development
It’s important to create a template with no parametrization for each script.
Using Fiddler or any other proxy server, one may ensure that all the queries from the template are similar to the queries from Fiddler. When checked, each request should be parametrized to ensure that it works properly for various users.
3. Scripts debugging
When a query is parameterized, it should be executed X times for various users to ensure its proper functioning. If each scenario in the scripts works correctly, the script debugging stage can be considered complete.
Stage 7 — Preliminary tests launch
Preliminary checks help to determine the most appropriate load model for the system. They also show how the application resources are used and whether the load generator(s) power will be sufficient for executing full-scale tests.
The checks should be launched under different load models. Thus, the testing load is determined on the basis of software monitoring and results analysis.
Stage 8 — Tests execution
Performance testing process consists of the following types of checks:
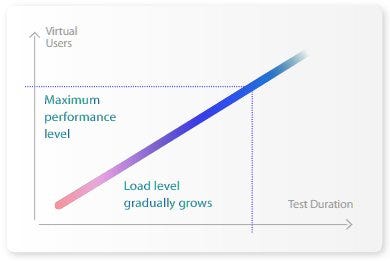
- During a stress test, the load will be gradually increasing until one of the test stopping criteria is reached.
Test stopping criteria:
- The response time exceeds the set value by several times.
- The critical level of the hardware resources usage is reached (CPU>80%, memory>90%).
- The number of HTTP errors exceeds 1% of the total request number.
- Fail of the system software.
Stress testing shows how the application reacts to an increased intensity of transactions and reveals the upper limit of the software performance.
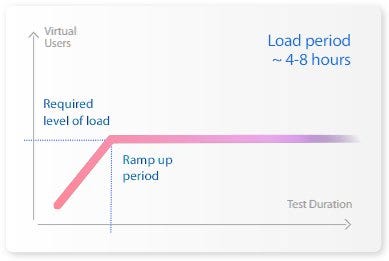
2. A load test is executed for an extended period of time (4–8 hours).
If the results of the stress check showed that the system hadn’t coped with the required load, the load test is executed under the load comprising 80% of the maximum value reached during the stress test.
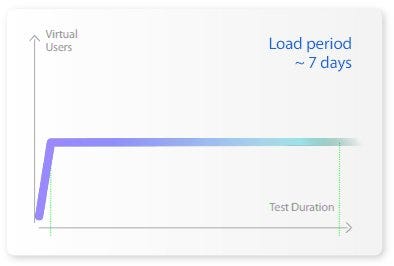
3. The stability test is conducted under an expected load for an extended period of time. When the maximum number of users has been reached, the load remains the same until the end of the check. The duration of the stability test can take up to several days.
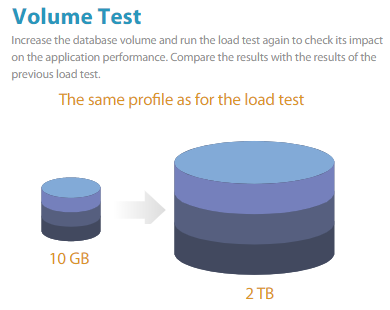
4. Volume test is used to evaluate the system performance under increased data in the DB. To conduct volume testing, one should fill in the database with the necessary amount of information.
5. Scalability test shows how the software performance is modified when the changes in the size of the application are made.
6. During the component test, the load is independently applied to the software units.
7. Rush hour check is executed to evaluate the system behavior both during the peak load and right after it. The load is applied to the application in a jump-like mode.
8. Configuration test reveals the most appropriate software configuration, which can provide the required performance.
Stage 9 — Results analysis and reporting
The results of the previous stages are used to prepare a document describing the outcomes of the executed tests and the implementation of each stage.
A testing report includes the following information:
- Performance testing goals
- Test environment and load generator configuration
- Application requirements
- User behavior scripts and load profile
- Statistics on the key performance characteristics (response time, number of queries per second, number of transactions per second)
- Information on the maximum number of concurrent users under which the system is capable to cope with the load
- Information about the number of HTTP errors and their types
- Diagrams showing how the system performance depends on the number of concurrent users
- Conclusion on the software performance in general and its bottlenecks if any
- Recommendations on how to improve application performance.
Originally published at https://www.a1qa.com.